Apollo's Torsten Slok Finds 'Zero' AI Payoff for the S&P 500 Outside the Magnificent 7
TL;DR
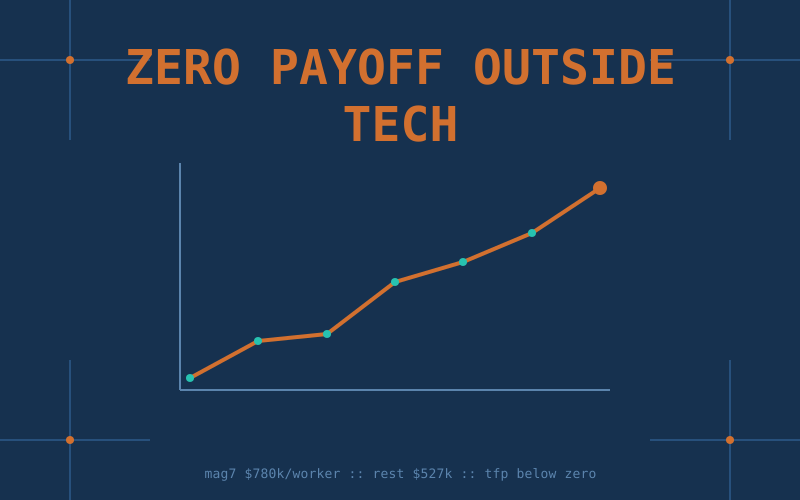
Apollo Global Management chief economist Torsten Slok published a five-chart note on October 24 titled No Signs of AI Payoff Outside the Tech Sector. His claim: AI "has delivered zero financial payoff to corporate America outside of tech." Inflation-adjusted revenue per employee at the Magnificent 7 has climbed from a 2023 low near $565K to about $780K, while the other 493 companies in the S&P 500 sit near $527K, close to where they were in 2019. Profit margins split the same way, just under 30% for the seven against about 10% for the rest. The San Francisco Fed's utilization-adjusted productivity measure has slipped below zero. And Ramp card data in the note puts 95.6% of OpenAI and Anthropic spend inside the top 10% of firms, with 80.4% of the top 1% of AI spenders VC-backed. The New York Fed read the same decade more kindly nine days earlier, and Goldman Sachs says the growth boost peaks within months.
The four claims and the charts behind them
Slok writes The Daily Spark, a one-page chart note that reaches a lot of fund managers before the open. The October 24 edition makes four claims and gives each one a chart.
"S&P 493" is his name for the S&P 500 minus Alphabet, Amazon, Apple, Meta, Microsoft, Nvidia and Tesla. The seven sell AI. The 493 are the ones supposed to be buying it. The note's last line: "the AI story will be decided in the S&P 493, not the Mag 7, and so far, there is no evidence that revenue growth or margins are improving outside the tech sector."
Revenue per worker
The first chart plots quarterly revenue per employee in thousands of dollars, deflated to 2019 Q4, from 2019 to the latest reported quarter. The Mag 7 line starts 2019 near $695K, sags to roughly $565K through late 2022 and early 2023, then climbs each year to about $780K in the latest print. The S&P 493 line starts near $495K, peaks around $548K in early 2022, and has drifted between $495K and $530K since. Latest reading: about $527K.
Because both series are deflated to 2019 Q4, a company that raised prices 20% and sold the same volume with the same headcount shows up flat here. That is the question Slok is asking: did AI let firms produce more per head in real terms.
Margins: 30% against 10%
The second chart runs from 2015. Mag 7 margins sat between 10% and 16% through 2019, reached about 22% by early 2022, fell back to roughly 14% in 2023, and have since risen to just under 30% in the latest quarter. The S&P 493 line is a flat band: about 8.5% in 2015, 9.5% in 2019, a brief 12% peak in early 2022, and about 10% now.
Slok has been on this beat since February. A February 10 edition showed consensus earnings expectations for the Mag 7 rising sharply since Liberation Day while the S&P 493's were unchanged, and a February 12 edition ran an earlier cut of the margin chart.
Productivity
Chart three is the macro check. It plots two measures of US productivity growth year over year since 1985: output per hour from the Bureau of Labor Statistics and total factor productivity from the San Francisco Fed, using John Fernald's utilization-adjusted series. Output per hour is growing a little above 2% a year. The TFP line has dropped from a bump above 3% in 2024 to just below zero in the latest reading. The SF Fed's own release, updated in October with data through 2026 Q2, has utilization-adjusted TFP down 0.07% over the four quarters to June and down 1.11% annualized in the quarter itself.
TFP is the growth left over after you account for more workers, more hours and more capital, and the utilization adjustment strips out the swings from factories running hot or idle. Picture a restaurant that grew revenue 10% after adding four tables and two cooks. TFP is the part of that 10% the new tables and cooks do not explain, which is the part that tells you whether the kitchen got better. On this measure, Slok says, the kitchen has not.
Where the tokens go
The fourth and fifth charts come from Ara Kharazian, chief economist at Ramp, whose AI Index tracks card and bill-pay spend across more than 85,000 US businesses. The table splits spend by category between the top 10% of firms and everyone else.
In model serving and inference, the bottom 90% of firms account for 0.5% of spend, which is less a market segment than a rounding error with a login. For OpenAI and Anthropic together it is 4.4%. The comparison rows keep this honest: even CRM, the most widely spread category on the list, puts 84.2% of spend in the top decile, so some concentration is just how business software sells. AI is more concentrated than cloud computing (95.7%) and well past paid ads and non-AI SaaS (around 92%).
The fifth chart is the one Slok titles "Circularity in AI shows up in token spending too." Among the top 1% of AI spenders, 80.4% are VC-backed. Among median spenders, 13.1% are. His reading: "VC-backed companies are spending more and more on tokens, but mainstream corporate America does not need the latest model and is unwilling to pay for it." Venture money raised on the AI thesis is buying the tokens that prove the AI thesis, which works until one of the loops stops.
Ramp's index page adds numbers the note leaves out. 55.9% of US businesses paid for AI tools in September, up 0.6 points from August and 12.1 points from a year earlier. Token spend in the week ending October 11 was 23% above the comparable week in September, with Anthropic taking 60.1% of it and OpenAI 36.4%. Among paying firms, the top 1% spend a median $9,567.53 per employee per month; the median firm spends $15.70. Adoption is wide and still inching up; the money sits with a thin top slice. "Pulling back" is Slok's reading of the concentration and VC-backing data, and Ramp's own growth line does not yet show it.
The other chart from a Fed
Nine days before Slok's note, the New York Fed's Liberty Street Economics blog ran a post by Jeremy Pearce, Revenue per Worker Is Up. Are Firms Getting a Larger Share?, using the same metric to reach a sunnier conclusion. Across US public manufacturing and services firms in Compustat, real revenue per worker grew 2.2% a year from 2019 to 2025, against 0.7% a year from 2010 to 2019. Sales-weighted operating margins rose from 16% of sales in 2019 to 18% in 2025; gross margins went from 34% to 37%. Firms with higher R&D intensity in 2019 saw the larger markup gains, which Pearce reads as a return on intangibles. Capital intensity showed no such pattern.
The two posts disagree less than their headlines. Pearce pools every firm, tech included, and seven companies can move a sales-weighted average; Slok's exercise is to remove those seven and look at what is left. Pearce never mentions AI and leaves open whether the margin gains are a return on years of intangible investment or "purely a windfall for firms." Read together: the aggregate has improved since 2019, and most of the improvement sits with the companies selling the models and the chips.
Goldman says the boost peaks soon regardless
Fortune paired Slok's note on October 26 with a Goldman Sachs client note from chief economist Jan Hatzius, who wrote that AI's boost to US growth was already set to peak in late 2026 or early 2027, before the recent worries about the AI investment boom. Hatzius puts the rise in developed-market long-term yields since early 2026 at about 100 basis points, attributes part of it to AI-related borrowing, and estimates that if it holds it subtracts a cumulative 0.6% from GDP. His base case is still that the investment "will ultimately pay off in terms of higher productivity and economywide profits." Slok's note makes no such promise. It ends with "AI may be a great calculator, but in business, intelligence is mostly judgment," which is a bold thing to write under five charts.
What this means if you sell AI to the 493
If your customers are mainstream enterprises rather than other AI startups, this note will be on your champion's CFO's desk by the time you ask for a budget line.
- Proof has moved up a level. "We saved 30 analyst-hours a week" still gets you the meeting. It no longer gets you the budget. The buyer's board wants the saving to show up in revenue per head or in margin, the two lines in Slok's first two charts, and will ask why it has not.
- Your pipeline is more VC-backed than it looks. If 80.4% of the top 1% of AI spenders are venture-funded, a vendor whose logo wall is Series B companies has revenue that tracks the venture funding cycle.
- "Does not need the latest model" is a pricing signal. Slok's claim that mainstream firms will not pay for frontier models landed the same weekend OpenAI priced GPT-6.1 Terra at half of Sol. Commoditized intelligence is the premise of his closing question, and the labs are cutting prices as if they agree.
- The productivity line is public and quarterly. The SF Fed updates utilization-adjusted TFP every quarter; if the AI dividend is real for the 493, it will show up there before it shows up on an earnings call.
Caveats
Apollo publishes the charts, not the series, so the dollar and margin figures above are read off the chart lines and are approximate to roughly $10K and one percentage point. The Mag 7 are not a control group: their margins rose on ad, cloud and chip demand, and some of that revenue is the 493's AI spend arriving as the sellers' income, so the chart shows where the money flows and says nothing about whether buyers get it back later. Aggregates hide timing; a pilot that started in 2025 would not show in 2026 revenue per head. And a note is a note: five charts and a page of prose, with no firm-level or use-case data behind the word "zero."
Key Takeaways
- Apollo's Torsten Slok says AI has delivered "zero financial payoff" to the S&P 500 outside the Magnificent 7, in a five-chart note dated October 24.
- Inflation-adjusted revenue per employee: Mag 7 about $780K and rising since 2023; S&P 493 about $527K, flat since 2019. Margins: just under 30% against about 10%.
- The SF Fed's utilization-adjusted TFP growth has slipped below zero over the past four quarters, while output per hour grows a little over 2% a year.
- Ramp data in the note: the top 10% of firms account for 95.6% of OpenAI and Anthropic spend and 99.5% of model serving and inference; 80.4% of the top 1% of AI spenders are VC-backed.
- The New York Fed's Jeremy Pearce finds real revenue per worker across public manufacturing and services firms grew 2.2% a year since 2019, three times the 2010s rate, without separating out the Mag 7.
- Goldman's Jan Hatzius expects AI's boost to US growth to peak in late 2026 or early 2027.
Sources: Apollo, No Signs of AI Payoff Outside the Tech Sector, Ramp AI Index, San Francisco Fed utilization-adjusted TFP, Liberty Street Economics, Revenue per Worker Is Up, Fortune, TechCrunch via Yahoo Finance, SiliconANGLE, Hacker News discussion