Mercor Maps 29 AI Benchmarks Onto 923 US Jobs and Finds 90% of Work Hours Unmeasured
TL;DR
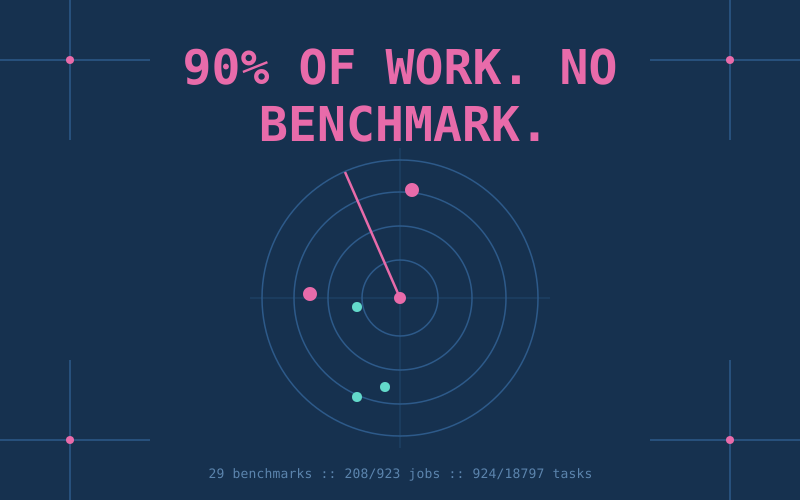
Mercor's Benchmark Map, released October 15, takes 29 agentic AI benchmarks and tags every prompt to a task in the Department of Labor's O*NET taxonomy of 923 occupations and 18,797 tasks. The result: 208 occupations and 924 tasks have at least five benchmark prompts, 6 of 22 job families have none, and Mercor estimates roughly 90% of American working hours go to tasks with little or no benchmark coverage. The benchmarks that do exist cluster on software engineering and finance, follow the biggest wage bills, and skip the physical and clerical long tail. Mercor calls the numbers provisional. They are still the first public attempt to say how much of the economy the leaderboards actually measure.
What Mercor built
Mercor sells expert labor to AI labs and runs the APEX benchmark family, so it has a commercial interest in the answer. Keep that in mind, and then check the method anyway, because it is simple enough to follow.
The company picked 29 benchmarks that meet five filters: at least 25 public tasks (or Mercor's own held-out APEX prompts), agentic work rather than multiple-choice Q&A, "economic realism," a cap per job family so software engineering does not swamp the index, and enough headroom that frontier models have not saturated them. The benchmark index runs from SWE-bench Verified (2024) through OpenAI's GDPval, Harvey's 2,010-task legal benchmark, Zapier's AutomationBench, Sierra's tau-bench variants, and Lica's 33,786-task Graphic-Design-Bench.
Then a frontier model (Mercor names GPT 5.6 Luna in its methodology page) reads each benchmark prompt and maps it to the O*NET 30.0 task it most resembles, following the tagging recipe from Wang et al. A task counts as "covered" once five or more prompts land on it. Coverage is then weighted by LLM-derived estimates of how much working time each task consumes (Hatgis-Kessell et al.) to produce the share of hours figure.
Think of it as a census of the exam questions. O*NET is the full list of what Americans are paid to do. Mercor asked how many of those line items have ever been put on a test.
The numbers
The three figures shrink in order. Benchmarks touch 22.5% of occupations, 4.9% of tasks, and somewhere around 10% of hours. Even inside a "covered" occupation, most of what the worker does all day has never been turned into a prompt.
Coverage is lopsided by field. In the family table Mercor publishes, Computer and Mathematical occupations lead at 29 of 36. Legal (5 of 7), Community Service (10 of 14), and Business and Financial (33 of 48) follow. Healthcare Practitioners sit at 12 of 89 and Education and Library at 9 of 62. Six families, which the page does not name, have nothing at all.
Benchmarks follow the money
Two regressions carry the paper's argument. First, O*NET tasks rated as AI-exposed (using the Eloundou et al. exposure ratings from 2023) are about 6x more likely to appear on a benchmark than unexposed tasks. That part is expected: nobody is writing an agentic eval for "empty trash receptacles."
Second, and less expected, tasks from occupations with larger total wage bills are significantly overrepresented even after controlling for exposure. Mercor fits a task-level logistic regression of coverage on exposure and log wage bill, with the wage-bill axis running from $500 million to $50 billion. Within an occupation, the tasks O*NET rates most important are 6-10x more likely to be covered than the least important ones.
The practical reading: benchmark authors build evals for jobs that are large, well paid, and digital, because those are the jobs whose automation someone will pay for. Lawyers' tasks are heavily covered. Legal secretaries and court clerks, who work in the same building on the same documents, are barely covered. Mercor's phrase for the gap is "the long tail of smaller, middle-income knowledge work jobs."
One HN commenter boiled that down to "they want AI to take the good jobs." Mercor would phrase it as a measurement gap. Both are describing the same chart.
Does weighting change the leaderboard?
Mercor also asks the obvious follow-up: if you re-weight a benchmark so every O*NET task counts equally, instead of every prompt counting equally, do model rankings move? For its own APEX prompts in investment banking (11 O*NET tasks, 176 prompts) the answer so far is: a little, not a lot.
Claude Opus 5.5 Max drops from 73.3% to 70.2%, Gemini 3.8 Flash and DeepSeek V4.1 Flash tick up, and nobody changes rank. Mercor reports the same pattern for law, accounting, and software engineering, with the caveat that fewer than a third of the O*NET tasks in those four occupations have enough APEX prompts to weight at all. Re-weighting cannot fix coverage that is not there.
The caveats Mercor lists itself
- The 29-benchmark list is incomplete. Leaving benchmarks out biases coverage downward, and Mercor says that bias is hard to bound. The real figure could be meaningfully lower than 90%.
- The unsaturated-only filter cuts the other way. Excluding benchmarks that frontier models have maxed out understates coverage of easier tasks, which are exactly the ones a model could already do.
- Tagging is an LLM judgment. On the 1,013 APEX prompts that human experts reviewed, the model's first-choice O*NET task was accepted 76.7% of the time (85.4% if any task on its candidate list counts). Disagreements were mostly within the right occupation, but 4.8% landed in a different job family entirely.
- "Economic realism" is a judgment call made by a company whose product is economically realistic benchmarks.
- Physical work is a hole, not a measurement. Using Dingel and Neiman's 37% remote-feasible figure, roughly 63% of US jobs involve some physical component, and the index has essentially nothing for them.
Why a builder should care
If you are picking a model for a vertical product, the leaderboard you are reading was almost certainly written for someone else's job. A model's SWE-bench or APEX-Agents score tells you about 924 of 18,797 tasks. For the task your customers actually pay for, assume no public eval exists and you need to write one.
The map is also a reasonable shopping list. The empty families (and the thin ones: healthcare at 13%, education at 15%, sales at 27%) are where a domain-specific eval would be both novel and, per Mercor's own regression, under-supplied relative to the wage bill. If you have the domain experts, that is where an eval would be worth writing.
Treat the 90% as a rough shape. Mercor says the estimate is provisional and promises a continuously updated index. Refining the number will not change the pattern behind it: benchmarks are dense where the people who write benchmarks work.
Key Takeaways
- Mercor's Benchmark Map tags 29 agentic benchmarks to O*NET's 923 occupations and 18,797 tasks; 208 occupations and 924 tasks have five or more prompts.
- Mercor estimates about 90% of American working hours fall on tasks with little or no benchmark coverage, and 6 of 22 job families have zero covered occupations.
- Coverage follows exposure (about 6x) and wage bills even after controlling for exposure; the most important tasks in a job are 6-10x more likely to be benchmarked than the least important.
- Computer and Math occupations are 81% covered; Healthcare Practitioners 13%, Education 15%.
- Re-weighting APEX investment-banking scores by O*NET task moves models 1-3 points and changes no rankings, but fewer than a third of tasks in the four studied occupations have enough prompts to weight.
- Mercor runs APEX and calls the estimate provisional; the LLM tagger matched human experts' first choice 76.7% of the time.
Sources: Mercor Benchmark Map, Mercor Benchmark Index, Mercor tagging methodology, Runtime Wire, Hacker News discussion, Eloundou et al. (arXiv), O*NET OnLine