Stripe's New AI Index Finds AI Businesses Growing 103% as the Pace Cools
On this page 8 sections
TL;DR
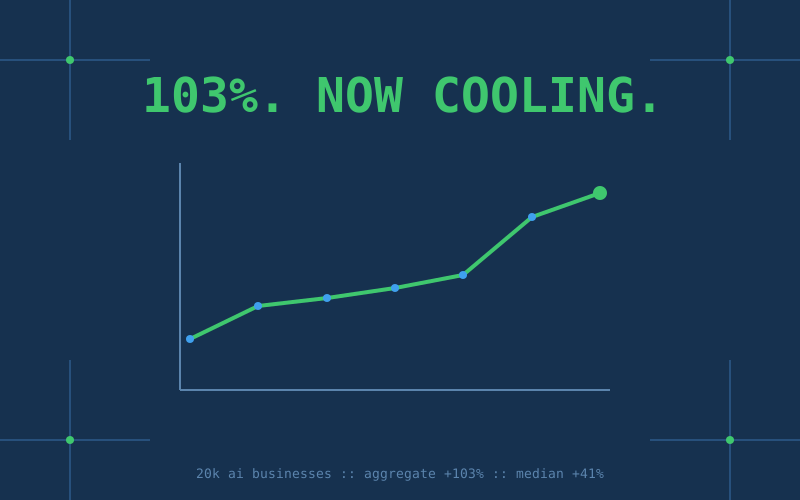
Stripe AI Index went live November 19 on Stripe Economics, and it is the closest thing to a live revenue tape for AI-native companies. It follows payments to nearly 20,000 of them, weekly. Over the 52 weeks ending November 8, aggregate pay-in volume rose 103% and the median business rose 41%; the non-AI SaaS businesses in September's companion index grew 33% and 15%. The fast signal bends down, though: 13-week growth ran at roughly 80% annualized, against a 140% pace a few months ago.
What Stripe shipped
Stripe sits on payment data for a fat slice of the internet's small businesses, so it sees revenue arrive months before anyone files a quarterly report. Economist Ernie Tedeschi, who built September's Stripe SaaS Index covering an average of 72,000 businesses a week, published the AI counterpart Thursday, and both now update weekly. Stripe titled the September post "The SaaSpocalypse was more like a RenaiSaaS", so the wordplay budget for the year was clearly spent before this one shipped.
Eligibility is stricter than "uses AI". A business qualifies when its core product or service depends on AI: an AI coding assistant, an image generator, or a service built specifically to support AI companies. Stripe classifies them through automated website review plus human checks, and requires a canonical domain and a first Stripe charge. A conventional business stapling an AI feature onto its SaaS does not count.
The index is same-business: it chains week-over-week payment growth for firms present in both weeks, so Stripe signing new customers cannot inflate the number. Think lap times for the same runners, rather than attendance at the stadium.
103 aggregate, 41 median
The two headline numbers measure different slices of the same population:
The aggregate caps any single business at 5% of a week's volume, so one enormous Stripe customer cannot wag the index. Even so, the weighted picture grows about two and a half times faster than the typical one. Stripe's reading: larger AI businesses are doing better, while the median business has grown at a steady pace all year.
A sharp reply on the post itself, from quant researcher Henry Zhang of QuantSignals, argues the split is partly mechanical. The aggregate index zero-fills payments for businesses that vanish or arrive mid-window, while the median only chains businesses paid in both weeks, so entry, exit, and churn land differently in the two statistics. The spread mixes concentration with survival, and the same asymmetry could be feeding the apparent cooling. Stripe has not published that decomposition.
The cooling, in three datasets
Growth of about 80% annualized over the latest 13 weeks is still enormous. It is also well below the 108% of the 26-week window and roughly 140% at the recent peak, and Stripe itself calls the pattern "some signs of cooling on a higher-frequency basis".
Independent data agrees. The Decoder, covering the Ramp AI Index built from transactions at more than 85,000 US companies, reports token prices fell 21.2% in six weeks while token volume rose to a record high, and that Ramp, Stripe, and OpenRouter all show the same shape: usage still climbing, revenue momentum easing. For anyone selling AI, volume has to do the growing from here, because the price per token keeps sliding.
Where the growth is
Payments to US-based AI businesses rose about 104% over the window, against 83% in the UK, 76% in the rest of the world, and 67% in the EU. Stripe says the US wedge is widening, and that the gap is even clearer in the level of the index than in the growth rates. Companies are classified by location, so each region's figure reflects global demand for businesses based there.
How it is built, and where it can fool you
After chaining, Stripe applies BOIWSA seasonal adjustment and an unobserved-components trend model, displaying one-sided filtered values. The appendix is candid that parameters are estimated on the full sample, which makes the history revisable rather than a real-time vintage. Treat old readings as subject to revision.
The index cannot see anything billed off Stripe, so enterprise-invoiced rivals are invisible, and Stripe says outright that it cannot replace audited revenue statements. It also measures all payments to a qualifying business, so a consultancy's services revenue counts the same as subscription product revenue. A services shop scaling headcount looks identical, in this data, to product revenue compounding on its own.
If you run one of the 20,000
- Benchmark against the median, 41% over 52 weeks. That is the typical AI-native business on Stripe; the 103% aggregate belongs to a concentration curve that flatters the biggest firms.
- Plan for the deceleration. An 80% annualized pace that has been stepping down for months is still excellent, and it sits well below the 140% peak. Budgets priced off mid-year growth will miss.
- Watch the weekly updates on Stripe Economics rather than inferring the market from launch threads and funding headlines; nothing else that reputable publishes this fast.
- Read the regional numbers as demand signals, not as advice on where to incorporate. The US wedge is an observation about where fast-growing AI businesses are based, and Stripe does not try to explain it.
- Remember the index sees payment volume and nothing else. Growth at these rates, with model inference bills attached, can still lose money.
Key Takeaways
- Stripe launched the weekly Stripe AI Index on November 19, covering nearly 20,000 AI-native businesses, as the AI counterpart to its September SaaS Index; both update weekly.
- Over the 52 weeks ending November 8, aggregate pay-in volume rose 103% and the median rose 41%, versus 33% aggregate and 15% median for non-AI SaaS.
- The pace is cooling: about 80% annualized over 13 weeks, from 108% over 26 weeks and roughly 140% at the recent peak. Ramp and OpenRouter data show the same bend.
- US-based AI businesses grew fastest at about 104%, versus 83% UK, 76% rest of world, and 67% EU, and Stripe says the US wedge is widening.
- Same-business Fisher chaining with a 5% cap per business keeps Stripe's own growth and any single whale out of the number. Commenter Henry Zhang notes the aggregate and median treat entry, exit, and churn differently, which can inflate the spread and some of the cooling.
- Builder use: benchmark at the 41% median, plan around an 80% and falling pace, and treat the series as revisable, since it cannot see off-Stripe revenue, costs, or margins.
Sources: Stripe Economics, "Introducing the Stripe AI Index" (Nov 19, 2026), Stripe Economics, "The SaaSpocalypse was more like a RenaiSaaS" (Sep 10, 2026), The Decoder, "AI industry growth remains strong, but the pace is slowing" (Nov 19, 2026), Ramp AI Index